Every regional installed-base number built from imagery carries two kinds of error, and strategy teams who treat them as the same thing end up with a denominator they can't defend in a board review. Sampling error is one of them. It's worth knowing exactly what it is before you cite a fleet count in a market-share memo.
What sampling error means in this context
In a dealer survey, sampling error comes from asking some dealers and not others, then extrapolating. In a satellite-based fleet estimate, it works differently: you're not sampling dealers, you're sampling sites. A site-level machine count gets pulled from a set of scenes, a region, a time window, and then scaled up to cover ground you didn't image on that pass. The gap between what the imagery captured and what's really sitting on every yard, lot, and job site in the region is your sampling error.
It shows up for reasons that have nothing to do with image quality: a revisit cadence that doesn't line up with equipment turnover, a region where coverage is thinner one quarter than the last, a scene pulled on a day when a subset of dealer lots happened to be mid-turn on inventory. Each of those is a property of coverage, not of the sensor: how much of the fleet the scene covered versus how much you're claiming to describe.
Sampling error vs. occlusion error
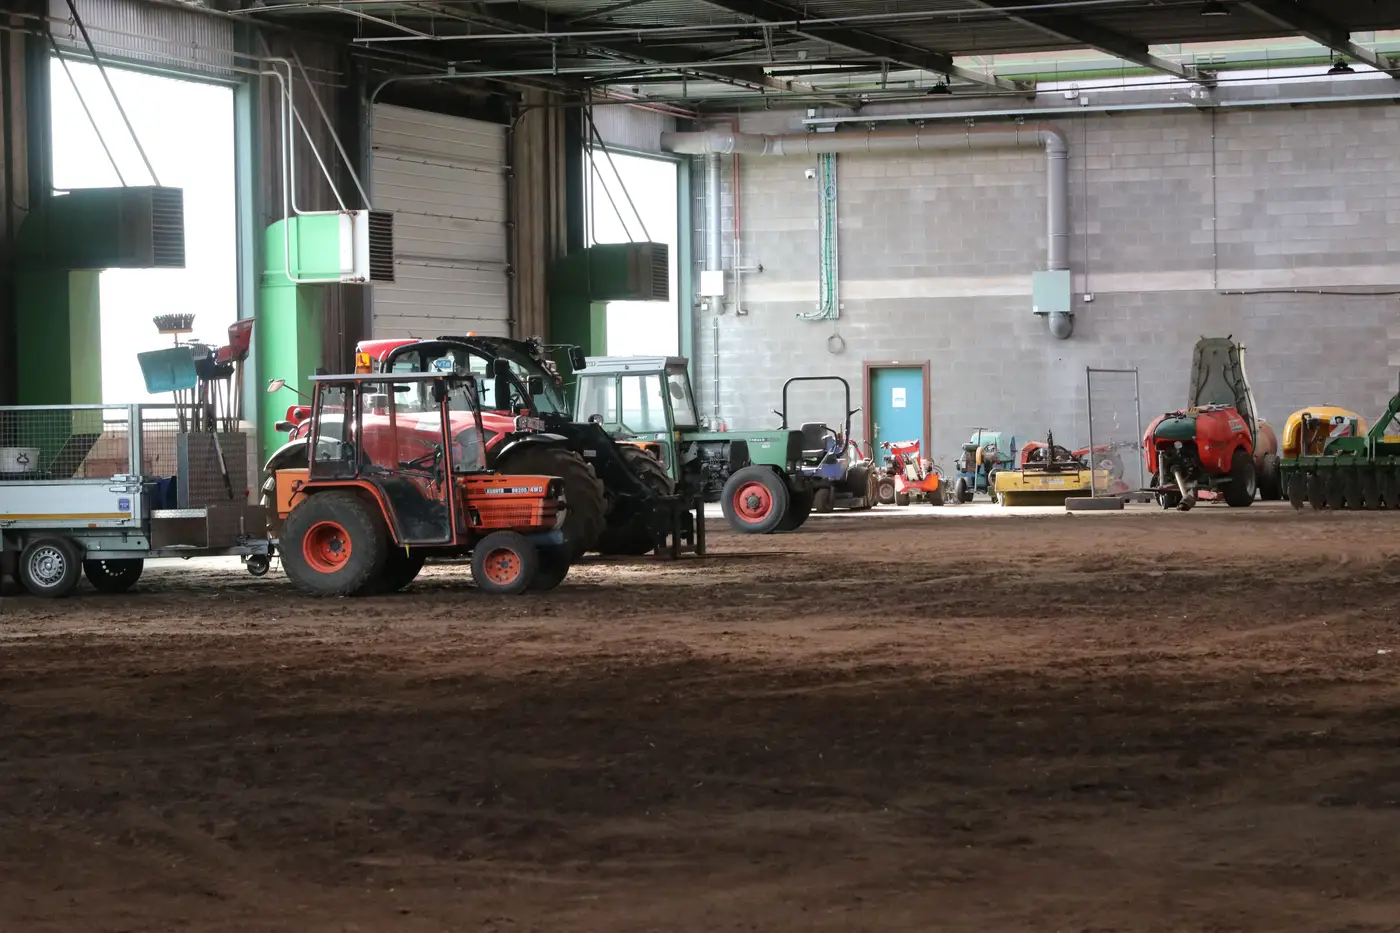
These two get collapsed into "the imagery was wrong" far too often, and that's the wrong diagnosis to hand your VP. Occlusion error happens at the pixel level: a machine sits under a canopy, in a covered bay, behind another unit, and the count misses it even though the scene covers that exact site. Sampling error happens at the coverage level: the scene never covered that site, or that week, at all.
The distinction matters because the fixes are different. Occlusion error gets addressed with correction factors tuned to a region's typical storage habits, covered sheds versus open yards, for instance, applied at the object-detection stage. Sampling error gets addressed with coverage design: how many sites per region, how often, and how the scaling math weights thin coverage against dense coverage before it hands you a regional total.
A denominator built without separating the two will look precise and still be wrong in a direction nobody can name. If someone asks why the number moved quarter over quarter, "coverage changed" and "the correction factor was off" are different answers, and they point to different fixes.
What this means for your confidence in the number
A fleet estimate with no stated uncertainty hides exactly where it's weak. When a regional installed-base figure is the denominator under a market-share calculation, the margin of error on the fleet count matters as much as the count itself, because that margin tells you how much weight the number can carry in a slide headed to the board or into a competitive response plan.
The honest answer to "what's the margin of error" isn't a single percentage slapped on every region. It's a function of how many sites were sampled there, how recent the coverage is, and how much occlusion correction had to do relative to raw counts. A region with dense, recent coverage and low occlusion carries a tighter number than a sparsely imaged region full of covered storage. Treating both the same way is how a defensible number turns into an indefensible one the first time a competitor, or a board member, pushes on it.
That's the problem Installed Fleet Estimation is built around: scaling site-level counts to a regional total with sampling and occlusion handled as separate, identified corrections instead of one unexplained adjustment.
If you're building a denominator that has to survive a hard question in a strategy review, it's worth requesting access and seeing how that scaling approach holds up for your region.