A regional installed-base figure with its method written down.
Site-level machine counts from high-res satellite imagery, scaled to a region with coverage and occlusion correction, on a quarterly target. Early access: we're proving the scaling method region by region.
- Platform
- High-res satellite
- GSD
- 0.5 m or finer
- Spectral
- RGB
- Cadence
- Quarterly (target)
The denominator slide
The market-share slide is easy. The number under it is not. You build the installed base from the side: cumulative sales by model year, a scrappage assumption, a dealer survey where the dealers answer, registrations or import data in the countries that publish them, and a vendor's dataset for the rest. Somewhere in that stack is a region where nobody has anything solid, so the dealers' own estimate goes in, and it is a view from the people selling the machines.
Then the deck goes to the investor or the planning committee. Someone asks where the denominator came from, and the honest answer is a chain of assumptions with a dealer's opinion at one end. You can defend each link. You can't show anyone the machines.
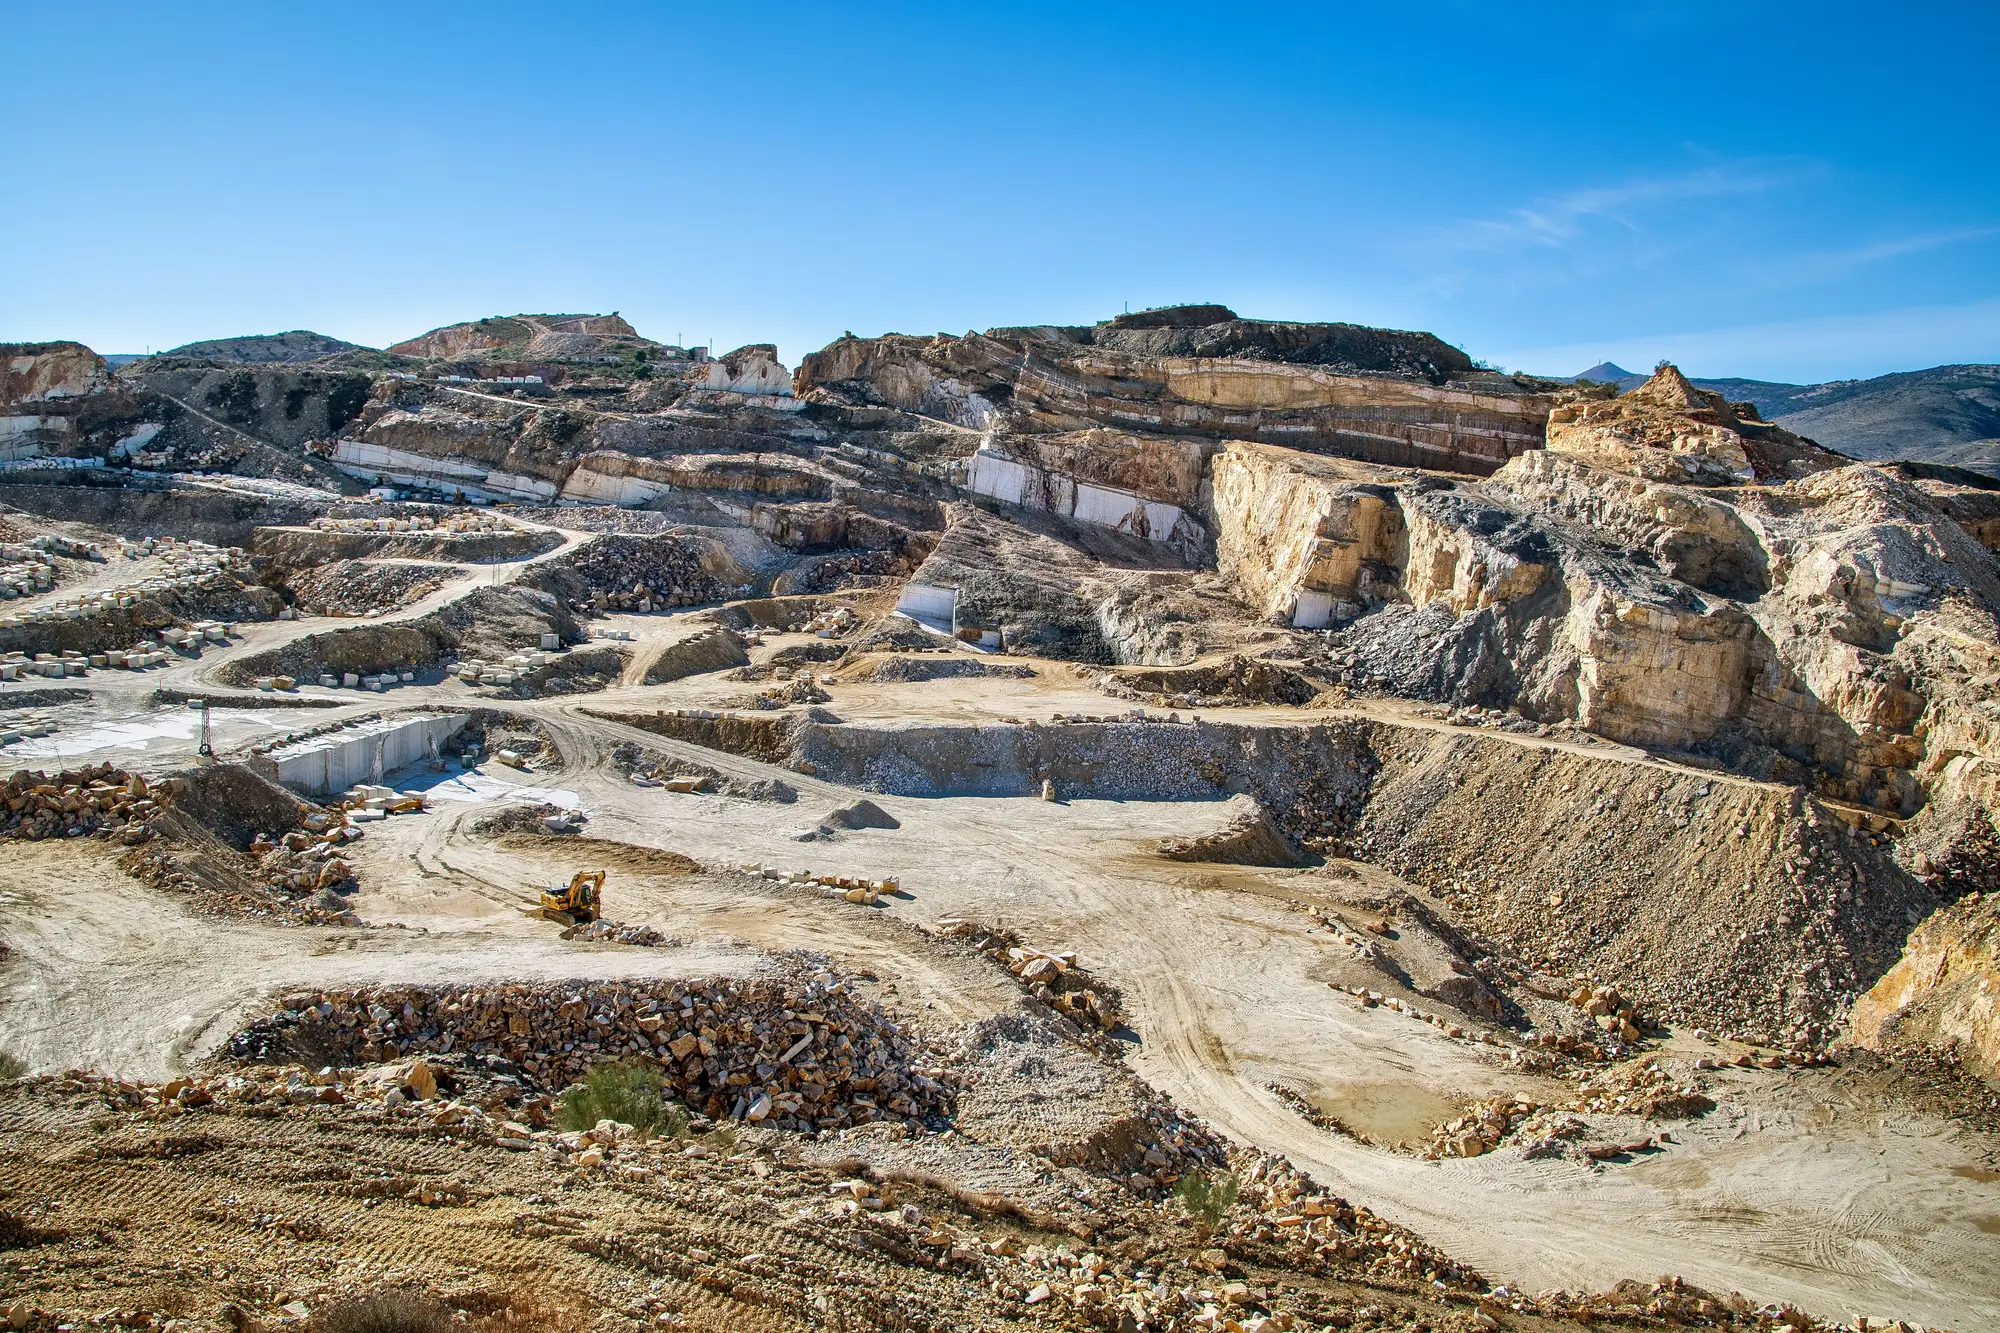
This service starts from the machines. We count them at a sample of sites on the imagery, correct for the ones the imagery could not see, and scale the count up to the region you define. The result is still an estimate, and the page says so. What changes is that the method is written down, planned to repeat quarterly, and open to your own diligence.
What you'd get each quarter
Early access, so these are what we'd set up with you in a pilot, not a finished product on a shelf.
Regional installed-base estimate
Figure and coverage note
One figure for the region you define, with a coverage note saying which parts of the region the sampled sites represent and which they don't. It is an estimate. It drops into the denominator cell of your model.
Site-level rollup table
CSV
Every sampled site with its count, and the lines that show what was counted on the imagery against what was scaled up. Open it in Excel and follow the figure back to the sites.
Scaling-method summary
Method note
A written description of how the sample was drawn, how occlusion and coverage were corrected, and what the method cannot say. Your diligence team or an investor's analyst can read it without calling us.
How it works
Step 1
Define the region and the site sample
You give us the region as your territory defines it and the kind of machine you're counting. We agree on the sites to sample.
Step 2
Count machines at each sampled site
High-res imagery of each sampled site is pulled on the quarterly target and the machines on it are counted.
Step 3
Correct for coverage and occlusion
Machines hidden by cloud, shadow or cover are allowed for, and so are the parts of the region the sample doesn't reach.
Step 4
Receive the estimate with its method note
The regional figure, the rollup table and the method note come back together, in time for the quarter's slides.
Where it fits in your workflow
It sits ahead of the market-share slide. The estimate is one input to your denominator, next to the sales-based stock model and the dealer survey, and it gives you something independent to reconcile them against. Where your other sources disagree, or where none exist, it is a third view built from a different kind of evidence. It does not replace your model; you still decide which figure goes in the deck.
Limits
An estimate, not a census
Every regional figure is scaled from a sample of sites. We don't publish a fixed interval, because how wide the uncertainty is depends on how much of your region the sample covers. Ask about your region.
Region feasibility is not assumed
Whether a region works depends on the imagery available over it and on whether its sites can be sampled. We tell you before you commit.
Only what the imagery can see
At 0.5 m a typical machine is a handful of pixels across. That is enough to count large machines outdoors and to tell a few broad types apart. It won't separate similar models, read a nameplate or see a machine parked inside a building.
Quarterly is a target
We plan to a quarterly cadence. Cloud over a site can push a count to the next clear pass, and the rollup says which sites were counted when.
Not yet proven everywhere
The scaling method is still being proven across regions. This is why the offer is early access.
Who this is for
- OEM strategy and market-intelligence analysts who need a regional installed-base figure with a documented method behind it.
- Teams whose dealer survey estimate or sales-based stock model is thin or disputed for a region.
Who this is not for
- Teams that need an exact count of machines in a region. This is an estimate.
- Teams that need machines identified by model or serial number.
- Teams that need a live feed of machine locations or usage.
Questions before you ask for access
Is this a definitive installed-base count?
No. It is an estimate with a documented coverage and occlusion correction. It is not a census.
How wide is the uncertainty?
We don't publish a fixed interval. It depends on how much of your region the sample covers. Ask about your region and we'll tell you what we can say.
Which regions can you do?
It depends on the imagery available and on whether the sites can be sampled. Don't assume coverage for yours; ask first.
How do we check it against our own numbers?
Put the rollup table next to your sales-based stock model and your dealer survey. Where they disagree, the site counts show where to look. We'll go through the method note with you.
Why quarterly?
A quarter matches the planning and investor cycle. It is a target, and cloud can push a site to the next clear pass.
Can we use the figure in an investor deck?
The method note is written so you can cite the method. What you may say publicly about the figure, and the licence on the imagery behind it, is settled in the agreement before the first delivery.
Does it plug into our models and dashboards?
There's no direct integration. The rollup table is a CSV that opens in Excel or loads into a BI tool.
Is this shipped or still in development?
Early access. The method is still being proven across regions, so we scope a pilot for your region rather than sell a published index.
How is it priced?
It depends on the region and the number of quarters, so we quote after we've seen the region. There's no price list on this page.
Tell us your region.
Name the region, the machine type and what the figure feeds. We'll say whether a pilot is feasible and what it would cover.
Request early access