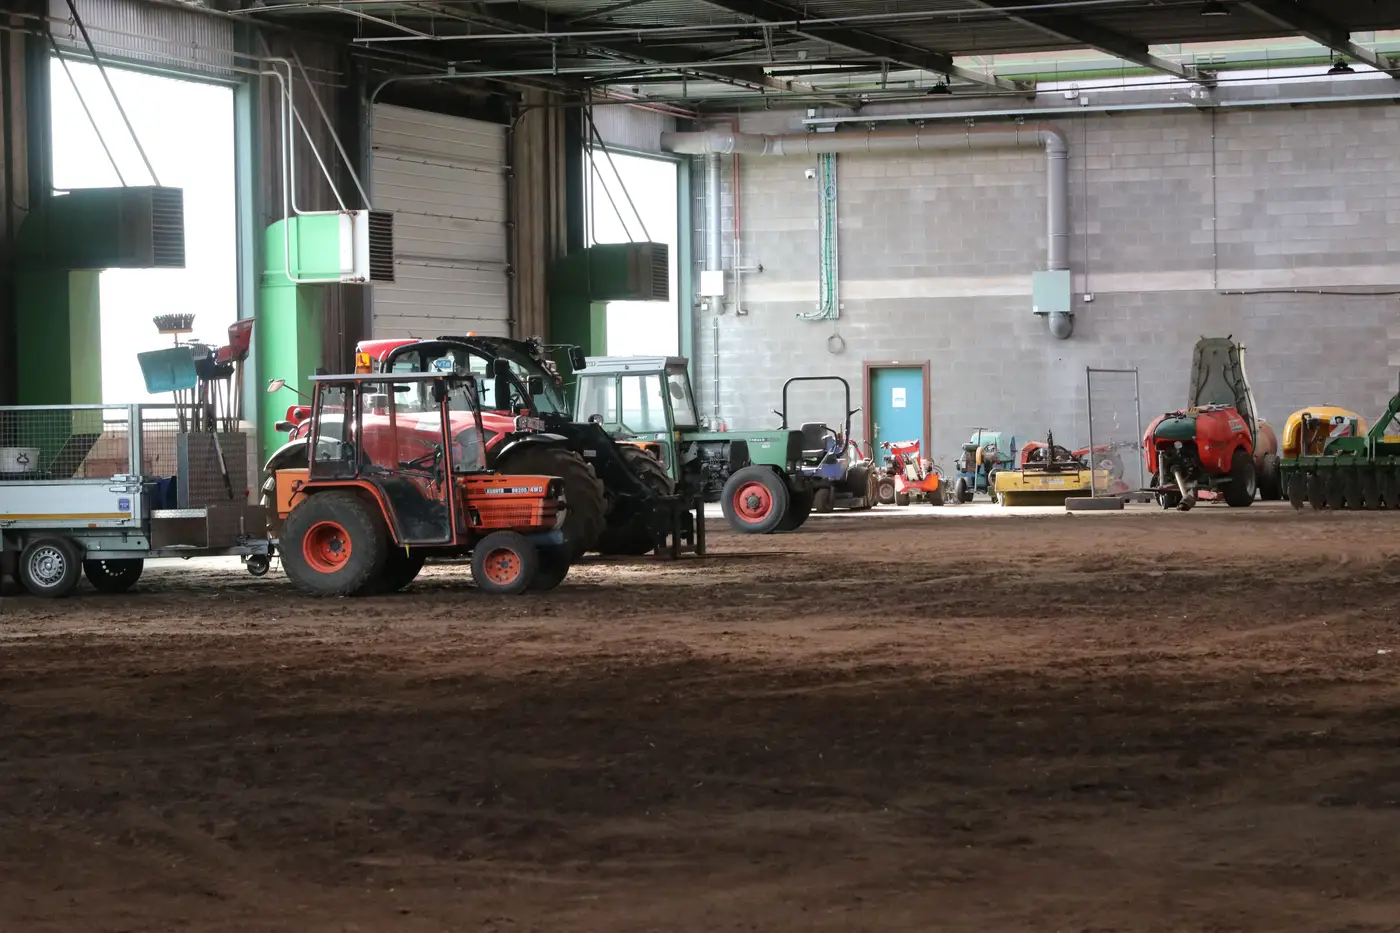
A raw count off a single satellite pass will always run low. Some share of the fleet at any dealer yard, rental depot, or project site is sitting under a roofed bay, tucked under tree canopy, parked nose-to-tail behind a bigger unit, or just sitting in the shadow line of a building at the wrong time of day. If you hand that number straight to a VP as "the installed base in Region X," you're handing them a number you already know is wrong, and you just don't know by how much.
The fix isn't a better image. Higher resolution helps you tell a skid steer from a compact track loader, but it doesn't put a roof back on the view. The fix is building a correction into the count before it leaves your desk.
Why occluded units aren't a rounding error
On a working yard, occlusion tracks the site's own layout rather than showing up at random. Roofed service bays and parts buildings hide the same stalls every time, so any unit parked there on pass after pass never shows up. Canopy cover does the same thing near rural dealer lots where equipment gets staged under tree lines to keep it out of direct sun. And on a busy rental yard, you'll regularly get two or three units backed in tight enough that the top-down footprint reads as one machine, or as pavement.
That means your miss rate isn't flat across site types. A paved city-fringe dealer lot with open storage might run close to a full count. A rural site with half its stalls under cover, or a project laydown yard where units get double-parked during a push, can miss a meaningful chunk of the fleet. If you apply one blanket "add 10%" fudge factor across every site in a region, you're just moving the error from "too low everywhere" to "wrong in a different direction at half the sites."
Two ways analysts actually correct for it
The methodical approach splits into two steps, and most defensible regional estimates do both.
First, classify sites by occlusion risk before you count. A site with open hardstand and no overhead structure gets treated differently from one with service bays, covered wash areas, or dense perimeter tree cover. This is a desk exercise against the imagery itself, cross-checked against site plans or street-level imagery where you have it.
Second, pull a ground-truth sample. For a handful of sites in each risk category, get an actual count, from a dealer-reported number, a site visit, or a higher-frequency image sequence that catches units moving in and out of cover over several passes. Compare that to what the single-pass satellite count showed for the same sites. The gap between the two gives you a correction factor specific to that occlusion category, not a number pulled from a trade article or a gut feel.
You then apply that category-specific factor across every site in the region that shares its occlusion profile, rather than applying one number to sites that don't look alike. A dealer lot with three covered bays and one with thirty don't get the same bump.
What makes the adjustment defensible, not just plausible
The difference between a number you can put in front of a board and one that gets picked apart in the first five minutes is documentation. You need to be able to say which sites were sampled for ground truth, what the raw miss rate was at each, how sites were bucketed into occlusion categories, and what correction factor got applied to each bucket. "We added 15% for occlusion" without that trail is a guess wearing a decimal point.
It also needs to be consistent across the regions you're comparing. If your West region count got a careful occlusion correction and your East region count didn't, you haven't built a market-share denominator. You've built two different methodologies that happen to share a map.
This is the part of the workflow Installed Fleet Estimation is built around: scaling site-level counts to a regional figure with coverage and occlusion correction baked into the method, so the number you're defending in a strategy meeting isn't a raw pixel count with a guess bolted on. If you're trying to get a regional installed-base figure that holds up past the first follow-up question, it's worth a look.