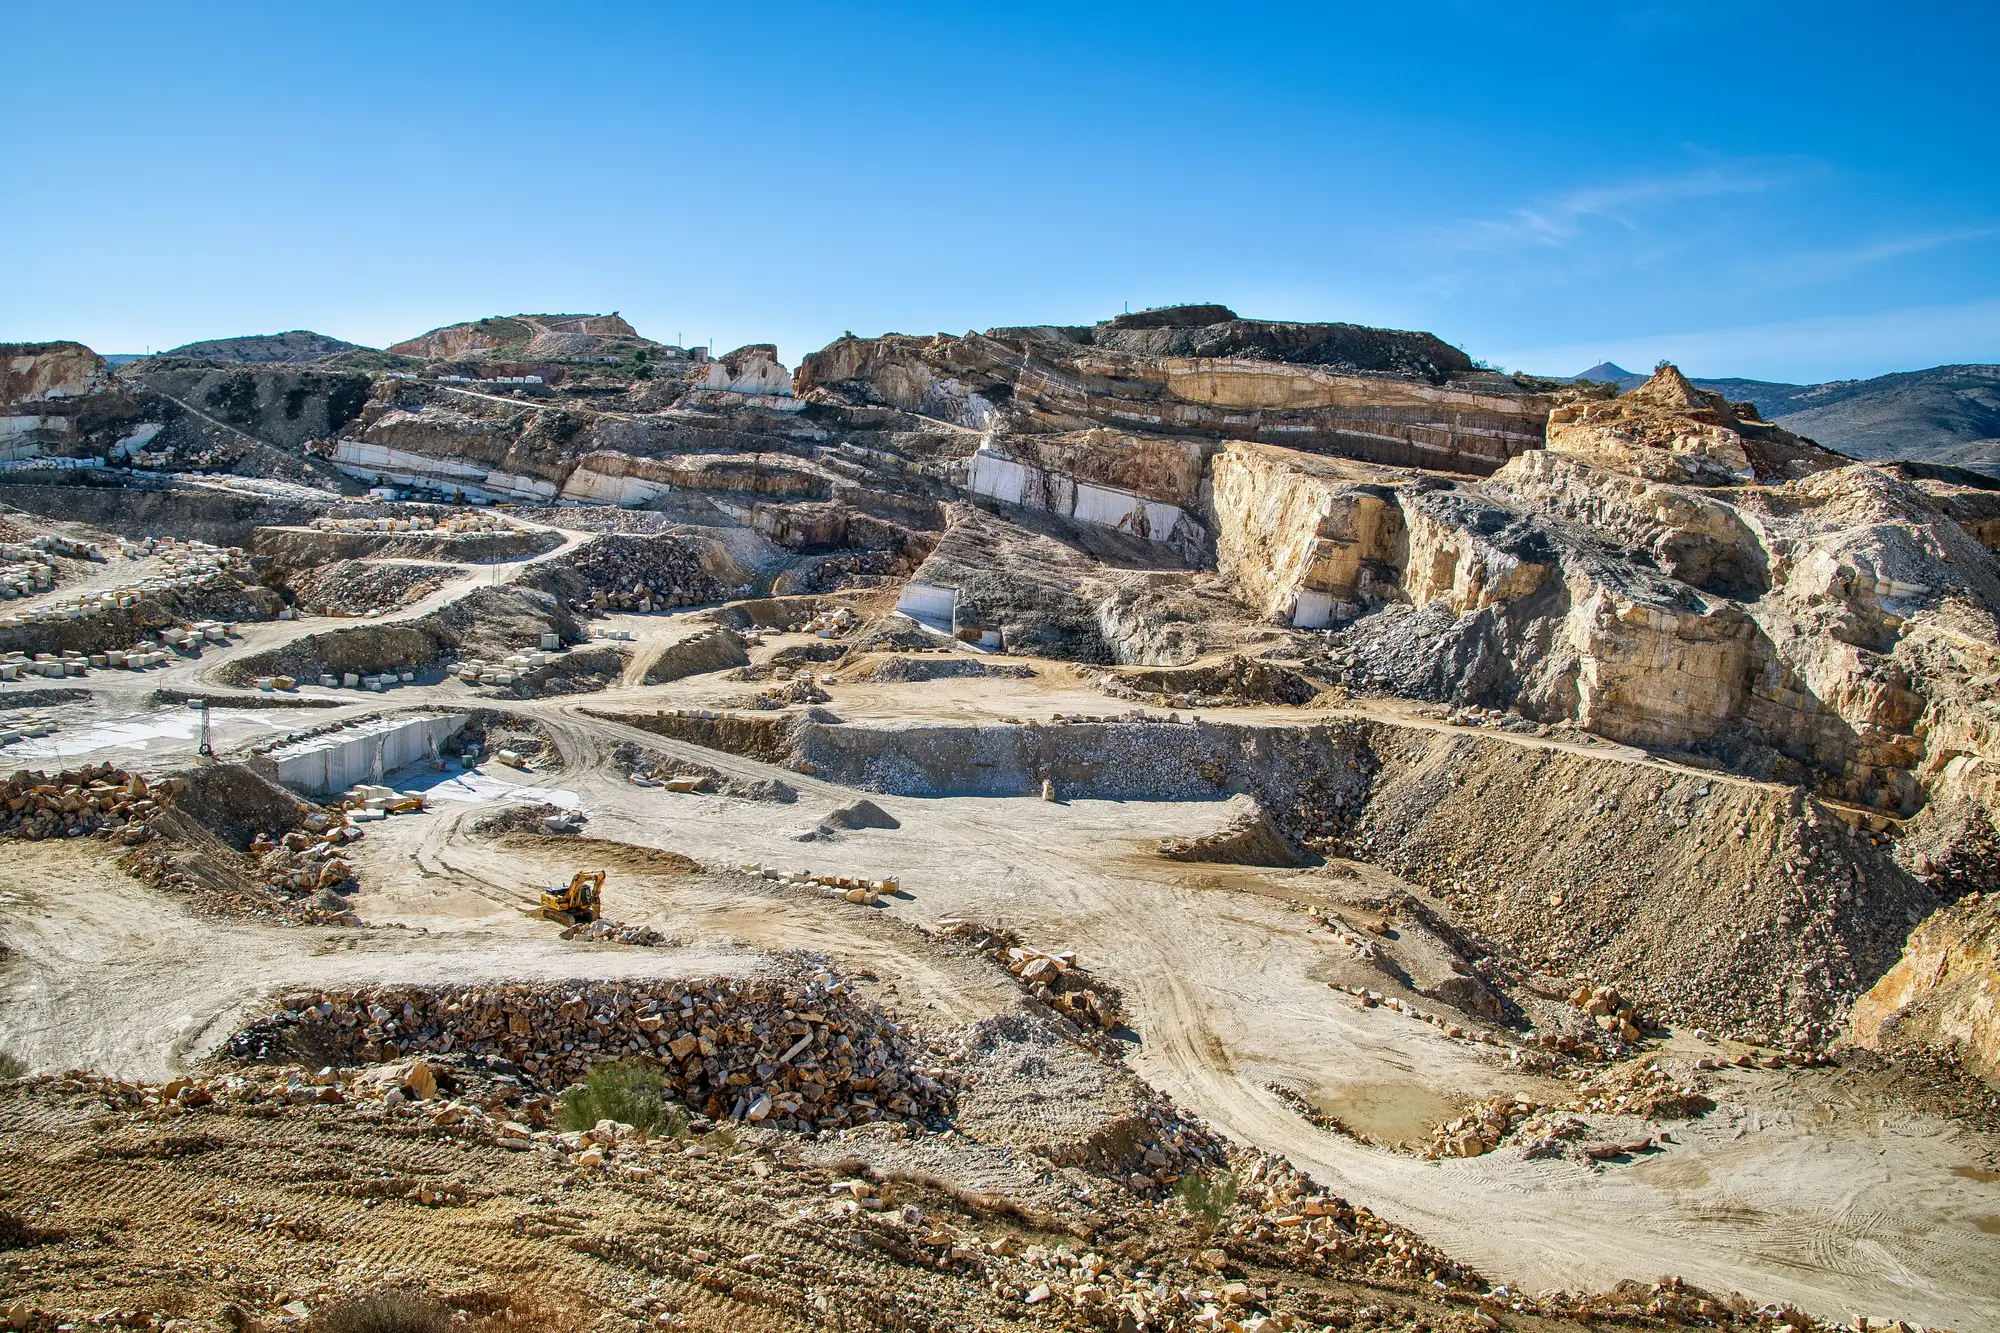
We draw sample regions the way a lot of people do this work: pick a boundary that's administratively convenient, usually a county line or a drive-time ring, and treat everything inside it as one tally. Clean in theory. Then you get a town that sits on the line itself, and a quarry a half mile outside that town, and two separate analysts both draw it into their count because the imagery tile happens to cross right through the stockpile.
That's roughly what happened on a recent pass. Two sample regions, drawn independently by two different people working from two different drive-time definitions, shared a boundary that ran through a small aggregates operation on the edge of a town neither region really claimed as its anchor. Region A's boundary logic pulled in everything within a certain radius of its county seat. Region B's logic pulled in everything within a radius of its own seat, going the other direction. The quarry sat in both radii. Every wheel loader, every haul truck parked at the crusher, every piece of yellow iron visible in that frame got scaled into both regional totals.
Nobody catches this by staring at one region's numbers. The count inside Region A looks normal. The count inside Region B looks normal. It's only when you stack the two regions into a combined figure, the way you'd have to if you're building a state-level or multi-state denominator, that the overlap shows up as a lump. Our check was dumb and effective: we plotted every identified site as a single point and flagged any point that fell inside the buffer of more than one region. The quarry lit up immediately, sitting about 400 meters inside the overlap.
The rule that holds up when someone on the strategy team asks how you got the number is simple: you don't split the machine count in half and give each region fifty percent. You assign the site to exactly one region, the one it's operationally part of. In this case that meant calling the quarry part of Region B, since its sales and service relationship ran through a dealer branch on that side of the line; Region A's tally got adjusted down. The alternative, splitting fractional machines across regions, produces a number that's defensible to a spreadsheet and indefensible to anyone who's run equipment counts before.
Boundary design generates most of the quiet errors in installed-base work. Counting a yard full of equipment from a clear image is the easy part. Deciding whether a site 400 meters inside two overlapping buffers belongs to one tally or two is where a defensible regional figure either holds together or doesn't. If your sampling frame doesn't have an explicit rule for boundary sites before you start counting, you'll find out the hard way, usually at the worst time, which is after someone's already cited the combined number in a deck.
This is also the part of the method that doesn't show up in a pitch. Most people sitting in a pitch meeting don't want to hear about reconciling a border-town quarry; they want the denominator. But the denominator is only as good as the seams underneath it, which is the whole reason we built out a coverage and occlusion correction process on top of raw site counts rather than just publishing a raw tally per region and calling it a day.
If you're scoping a regional installed-base figure and want to talk through how boundary overlap gets handled before you commit to a sampling frame, get in touch.